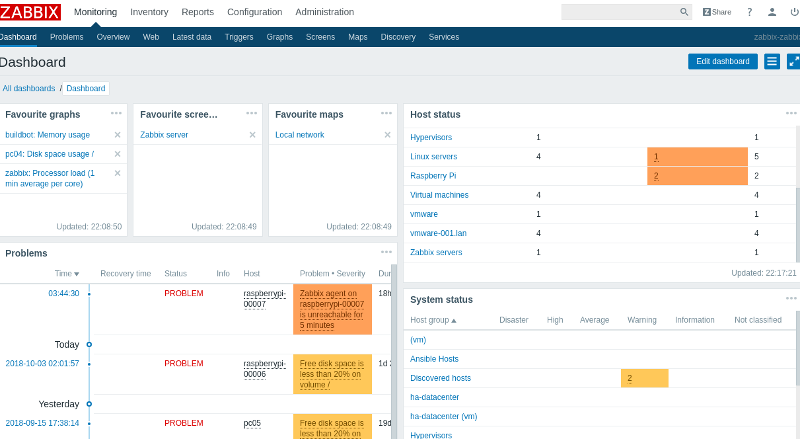
In this article I go over the components of the Zabbix server and agent, and describe how they can be configured with ansible. If you just want to get started with configuring, then you can jump to part 2, where I get into the details of the tasks in ansible.
Zabbix is an open source monitoring tool, written in C and PHP, and has been in continuous development since 2001. The agent and server side components run on Linux and most unix style server operating systems. In addition to Linux, the agent can be deployed on Windows server and/or desktop with a good range of monitoring metrics supported out of the box.
For many sysadmins Zabbix is a super powerful tool with extensive features and configurable 3rd party integrations, however like many open source systems it is non-trivial to configure manually and integration with other systems can be time consuming.

How ansible works with Zabbix
Ansible can help with configuring zabbix in several useful ways.
- To install and configure the Zabbix distro packages, and their dependencies, such as apache and mysql
- Once zabbix is installed and running, to configure zabbix users, hosts, and alerts
- To configure zabbix integration with external systems. (and if necessary, to deploy those external services)
Basic zabbix based monitoring installation
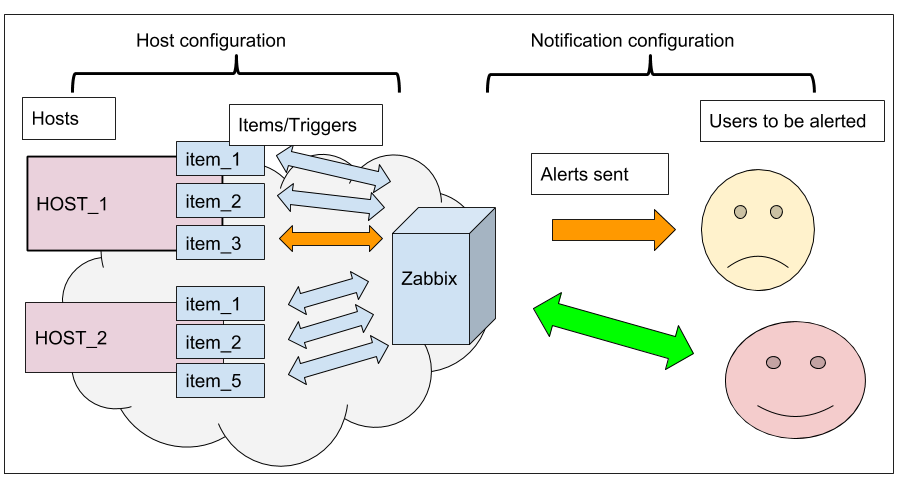
In order that any monitoring solution to be useful, several classes of objects need to be configured into the system. The server needs to know devices to monitor, what services are running on those devices, the level of importance of each service, and how to respond when the status changes.

At the top level these objects are:
- Hosts
- Notifications
- Users
below that we have the resources that can be monitored on each host, any contact details for each User, and how to prioritize and notify users of status changes.
Configuring the Hosts to be monitored
Zabbix supports several types of host registration. You can either add the host to zabbix directly from the GUI, or you can use auto-discovery to allow hosts to register themselves. In this tutorial we will be registering the hosts ourselves, as this is easy to do with ansible.
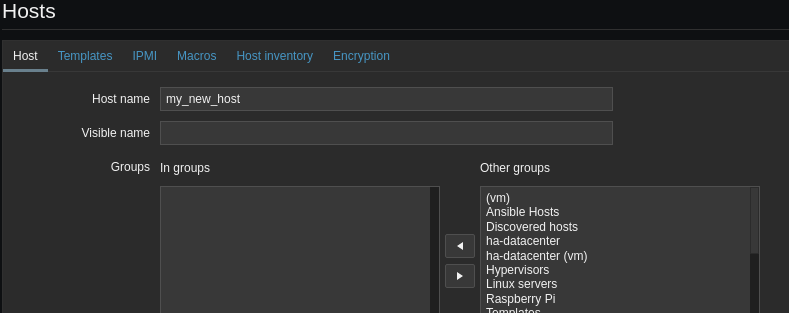
Create a host from the GUI…
 But that’s not what we are going to do here…
The power of a monitoring system is how much it can work out for itself, in terms of the important things to monitor on each host. In the case of Zabbix, it provides a set of default Templates with various Items and Triggers which serve as a sound basis for useful monitoring.
Zabbix refers to each value that can be monitored on a host as an “Item”, and the value of the item which represents a problem as a Trigger
Configuring hosts
Zabbix has several monitoring modes available, depending on the type of device to be monitored. Full full fat OS devices, such as an Ubuntu web server, a CentOS mysql server, the most common approach is to use agent based monitoring. However Zabbix also supports monitoring over SNMP
